Introduction to Gauge Widgets
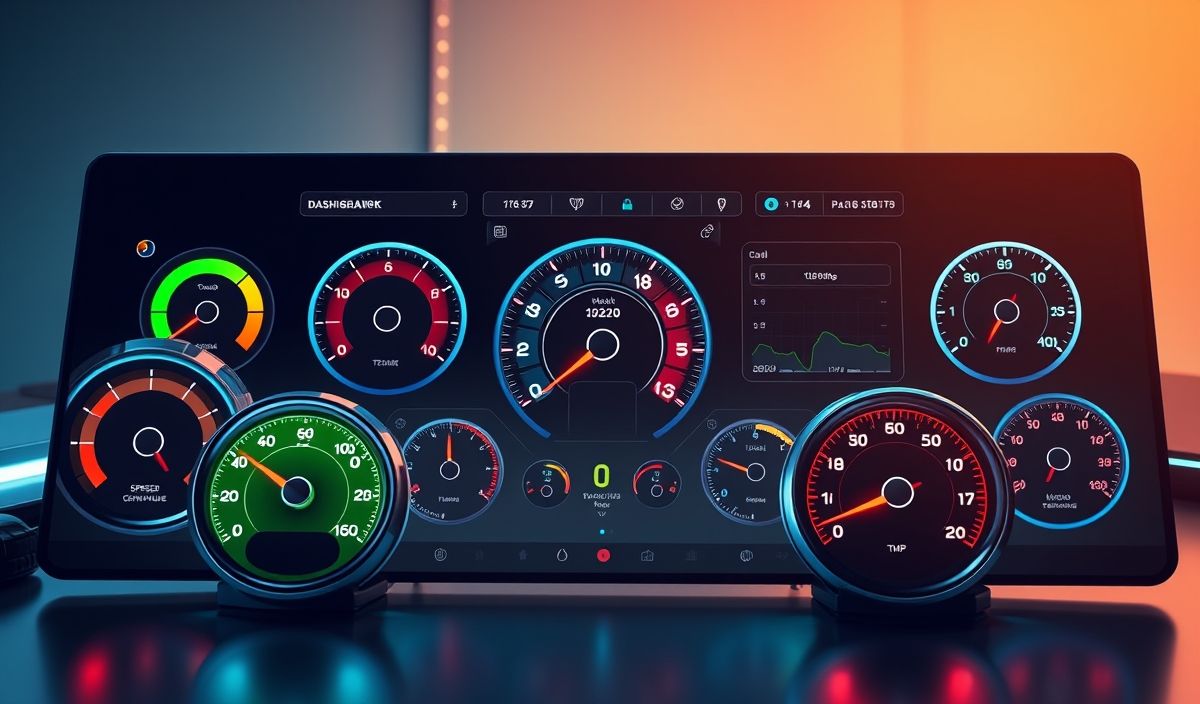
A gauge widget, also known as a gauge chart, is an advanced graphical tool designed to display data through a circular arc. It is highly effective for representing performance metrics, speed, pressure, temperature, and other important indicators. Gauge widgets are invaluable in dashboards, providing an instantaneous overview of system health or performance metrics.
Using the Gauge Widget API
This article introduces various API methods and techniques to get the most out of your gauge widgets. We will go through the initialization, configuration, and customization processes with handy code snippets.
Initialization
const gauge = new Gauge({
  renderTo: 'gauge-container',
  width: 400,
  height: 300,
});
gauge.draw();
Setting Gauge Options
You can customize the gauge appearance and behavior with various options:
gauge.setOptions({
  value: 50,
  minValue: 0,
  maxValue: 100,
  animationSpeed: 32,
  pointer: true,
  color: '#00ff00',
});
Updating Gauge Values
Updating gauge values dynamically is essential in creating real-time dashboards:
gauge.setValue(75);
Clear Gauge
If you need to reset or clear the gauge:
gauge.clear();
Custom Gauge Colors
Gauge colors can also be customized to enhance visual appeal:
gauge.setOptions({
  colors: {
    plate: '#fff',
    majorTicks: '#f5f5f5',
    minorTicks: '#ddd',
    units: '#666',
  }
});
Event Handlers
Responding to user interactions can be implemented using event handlers:
gauge.on('click', function(e) {
  console.log('Gauge clicked at value: ' + gauge.getValue());
});
App Example Using Gauge Widgets
Let’s build a simple dashboard application to see the gauge widget in action:
HTML Structure
<!DOCTYPE html>
<html>
<head>
  <script src="path/to/gauge-library.js"></script>
</head>
<body>
  <div id="dashboard">
    <div id="speed-gauge-container"></div>
    <div id="temp-gauge-container"></div>
  </div>
  <script src="dashboard.js"></script>
</body>
</html>
JavaScript Implementation
document.addEventListener('DOMContentLoaded', function() {
  const speedGauge = new Gauge({
    renderTo: 'speed-gauge-container',
    width: 200,
    height: 200,
    title: 'Speed',
    minValue: 0,
    maxValue: 200,
    value: 60
  });
  speedGauge.draw();

  const tempGauge = new Gauge({
    renderTo: 'temp-gauge-container',
    width: 200,
    height: 200,
    title: 'Temperature',
    minValue: 0,
    maxValue: 100,
    value: 25
  });
  tempGauge.draw();
});
Through this example, you can see how powerful and versatile gauge widgets can be in visualizing data effectively on your dashboards.
Hash: a90fd9a9a1e66597ae124f542f73ac08d3112e7d6f5e1781163be07ccae5be0d