Introduction to JupyterLab Widgets
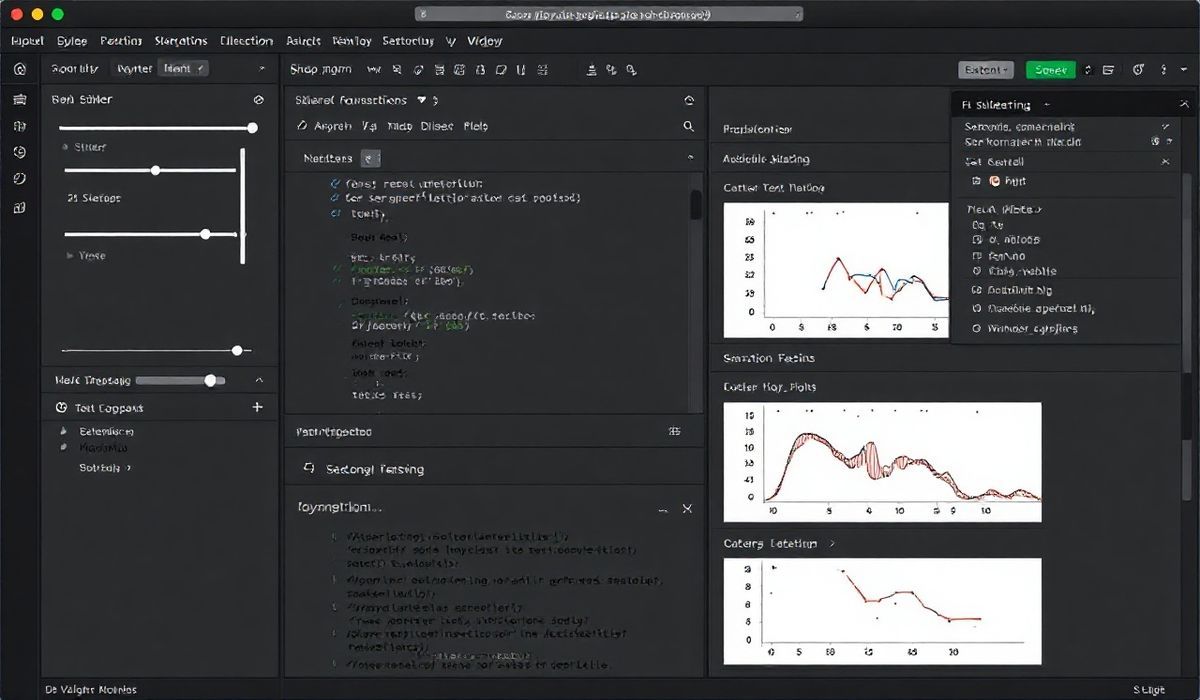
JupyterLab Widgets provide a powerful way to create interactive user interfaces in Jupyter notebooks. These widgets are part of the ipywidgets library and offer dynamic controls like sliders, text boxes, buttons, and more for building rich interactive applications.
In this article, we will explore some core APIs, their applications with extensive code examples, and a sample app to demonstrate JupyterLab Widgets in action.
Getting Started
First, you need to install ipywidgets. You can do this using pip:
pip install ipywidgets
To enable widgets in JupyterLab:
jupyter labextension install @jupyter-widgets/jupyterlab-manager
Core APIs and Examples
1. Slider Widget
The IntSlider lets users pick numeric values using a slider:
  from ipywidgets import IntSlider, interactive
  import IPython.display as display

  slider = IntSlider(value=10, min=0, max=100, step=1, description='Slide:')
  display.display(slider)
2. Text Box Widget
The Text widget provides an input field:
  from ipywidgets import Text

  text = Text(value="Enter text", description="Text:")
  display.display(text)
3. Button Widget
Use the Button widget to bind actions:
  from ipywidgets import Button

  def on_button_click(b):
      print("Button clicked!")

  button = Button(description="Click Me")
  button.on_click(on_button_click)
  display.display(button)
4. Dropdown Widget
The Dropdown widget allows for the creation of selection menus:
  from ipywidgets import Dropdown

  dropdown = Dropdown(options=['Option 1', 'Option 2', 'Option 3'], description='Choose:')
  display.display(dropdown)
5. Interactive Output
The interactive function links widgets to Python functions:
  def greet(name):
      return f"Hello, {name}!"

  from ipywidgets import interactive
  interactive_widget = interactive(greet, name=Text(value="User"))
  display.display(interactive_widget)
Sample Application: Interactive Plot Viewer
Here’s an application combining multiple widgets to create an interactive plot viewer:
  import numpy as np
  import matplotlib.pyplot as plt
  from ipywidgets import FloatSlider, interactive

  def plot_function(a, b):
      x = np.linspace(-10, 10, 100)
      y = a * x + b
      plt.plot(x, y)
      plt.grid(True)
      plt.title("Interactive Plot")
      plt.xlabel("x")
      plt.ylabel("f(x)")
      plt.show()

  a_slider = FloatSlider(value=1.0, min=-5.0, max=5.0, step=0.1, description="a:")
  b_slider = FloatSlider(value=0.0, min=-10.0, max=10.0, step=0.1, description="b:")
  interactive_plot = interactive(plot_function, a=a_slider, b=b_slider)
  display.display(interactive_plot)
Conclusion
JupyterLab Widgets are an excellent tool for building interactive and data-driven applications in scientific computing. By integrating these widgets into your notebooks, you can provide a more engaging and user-friendly experience for data exploration and visualization.


