Introduction to Graphviz: Powerful Graph Visualization Software
Graphviz is an open-source graph visualization software that allows you to represent structural information as diagrams of abstract graphs and networks. It’s flexible, powerful, and has a wide range of applications, from bioinformatics to social network analysis.
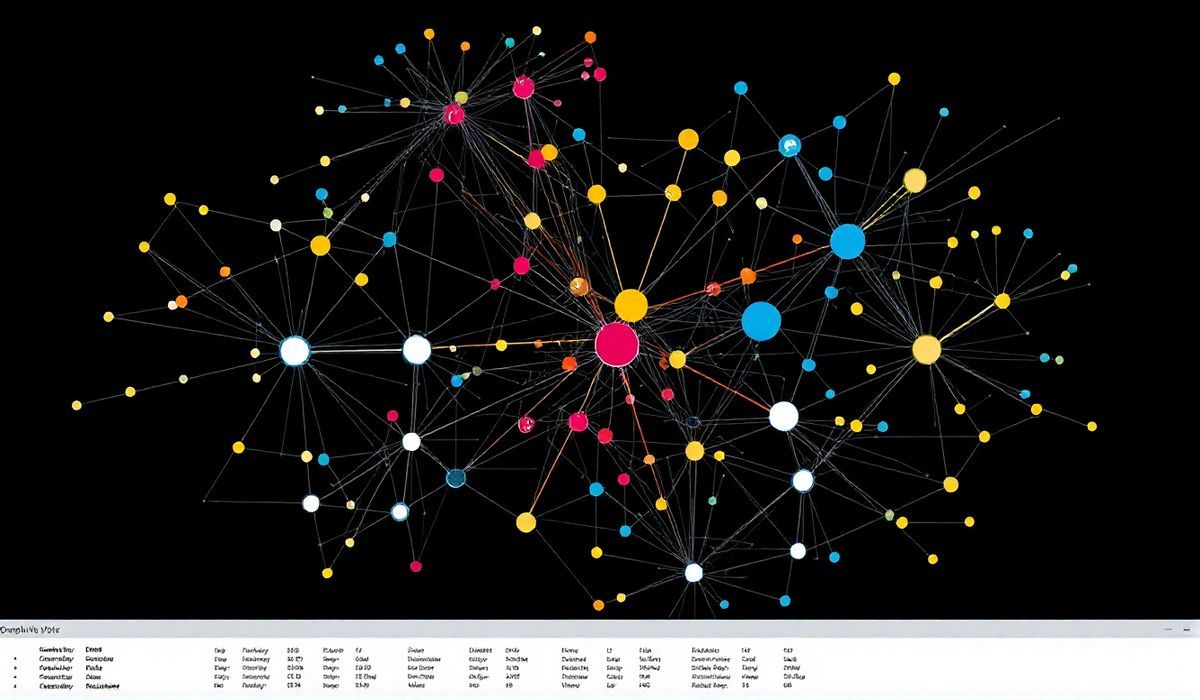
Graphviz API Examples
Basic Graph Creation
  digraph G {
    A -> B;
    B -> C;
    A -> C;
  }
This code creates a simple directed graph with edges directed from A to B, B to C, and A to C.
Customizing Node Shapes
  digraph G {
    node [shape=box];
    A -> B [color=blue];
    B -> C [color=red];
    A -> C [color=green];
  }
Customizes the shapes of the nodes to boxes and colors the edges differently.
Adding Labels to Nodes and Edges
  digraph G {
    A [label="Start"];
    B [label="Process"];
    C [label="End"];
    A -> B [label="Step 1"];
    B -> C [label="Step 2"];
  }
Labels nodes and edges to provide more context and information within the graph.
Subgraphs and Clustering
  digraph G {
    subgraph cluster_0 {
      style=filled;
      color=lightgrey;
      node [style=filled,color=white];
      a0 -> a1 -> a2 -> a3;
      label = "process #1";
    }
    A -> B;
    B -> C;
  }
This example creates subgraphs to group related nodes and edges together.
Combining Graph Attributes
  digraph G {
    graph [rankdir=LR];
    node [shape=circle, style=filled, color=lightblue];
    A -> B [style=dotted];
    B -> C [style=dashed];
    C -> D [style=bold];
  }
This illustrates how to combine graph attributes like direction, node styling, and edge styling.
App Example with Graphviz APIs
Below is a complete example of a graph visualization application using Graphviz API:
  import graphviz as gv

  def generate_graph():
    dot = gv.Digraph(comment='Graph Application Example')

    dot.node('A', 'Start', shape='ellipse', style='filled', fillcolor='yellow')
    dot.node('B', 'Decision', shape='diamond', style='filled', fillcolor='orange')
    dot.node('C', 'Process 1', shape='box', style='filled', fillcolor='lightblue')
    dot.node('D', 'Process 2', shape='box', style='filled', fillcolor='lightgreen')
    dot.node('E', 'End', shape='ellipse', style='filled', fillcolor='red')

    dot.edges(['AB', 'BC', 'CD', 'DE'])

    return dot.source

  if __name__ == '__main__':
    graph_source = generate_graph()
    print(graph_source)
This application will generate a graph featuring different node shapes, colors, and edge directions, illustrating a workflow from start to finish.
Hash: 74a87c2b6b9cca8b666883b7127bc2f6715bb86a0ac03520e4b7ffdb5db2a76c